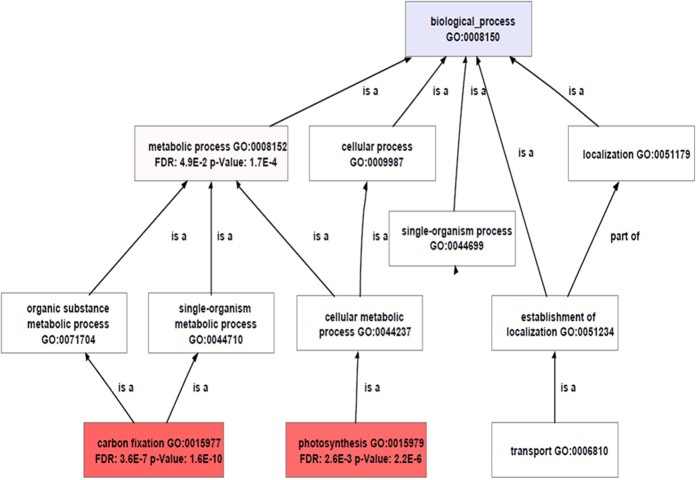
Figure 6. Gene ontology analysis of DEGs.
GO enrichment analysis of biological process. These nodes are indicated with different colors proportionally according to their significance multiple-test P value (The value smaller, mean more significant and thus the nodes darker and redder), with the threshold FDR <0.05.

