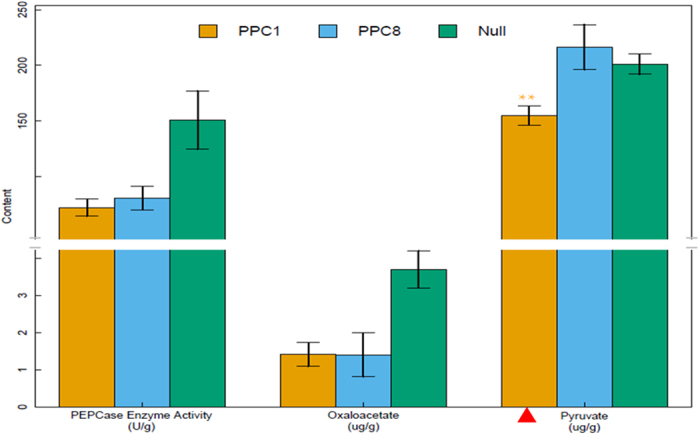
Figure 8. PEPCase enzyme activity, pyruvate and oxaloacetate content were detected in transgenic lines and null plants.

The red triangle indicates that the plant has highest oil content in all the tested transgenic lines. All the experiments are repeated three times. Bar graphs represent the average activity or content ± SD of three replicates. *Denotes significant differences (P < 0.05).
