
Fig. 6.
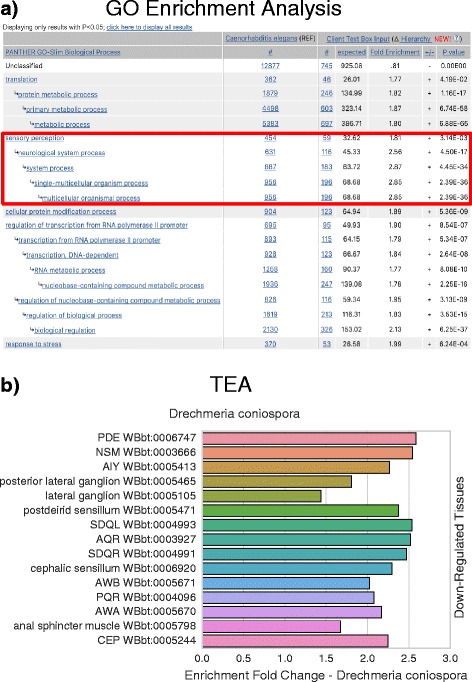
D. coniospora gene enrichment analysis and tissue enrichment analysis results. We compared and contrasted the results from a gene enrichment analysis program, pantherDB, with TEA by analyzing genes that were significantly down-regulated when C. elegans was exposed to D. coniospora in a previously published dataset by Engelmann et al. [25] with both tools. a pantherDB screenshot of results, sorted by p-value. Only top hits shown. b TEA results, sorted by q-value (lowest on top) and fold-change. Both pantherDB and TEA identify terms associated with neurons (red square). The two analyses provide complementary, not redundant, information