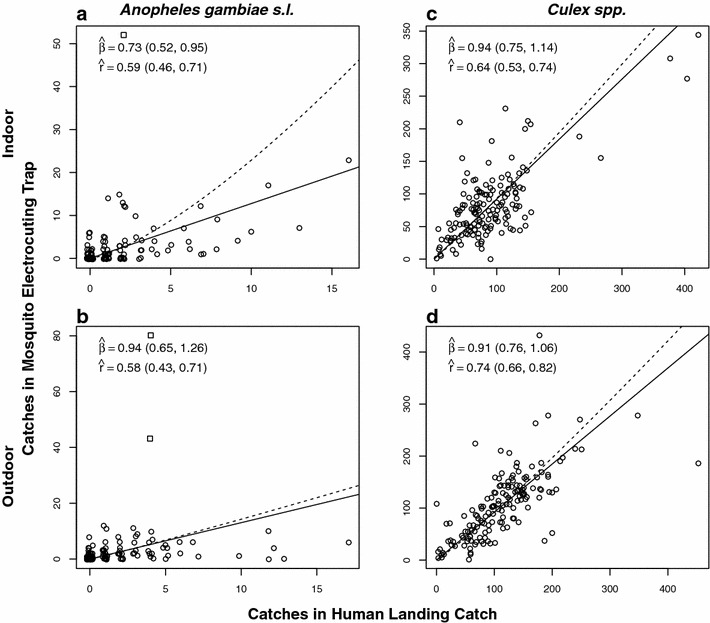
Fig. 4.

Panels illustrate density-dependence by plotting the mosquito catches in MET against those in HLC. a, b represent An. gambiae s.l. catches indoors and outdoors, respectively, while c, d represent Culex spp. catches indoors and outdoors, respectively. Data points are open circles, except for three data points, depicted with open squares, which represent high outlier MET catches or low outlier HLC catches (see text for details). Estimates and 95 % CIs are given for the density dependence exponent, (), and the linear correlation coefficient (). Model-predicted relationships are shown between the MET and HLC catches as estimated with either the linear density independence model (solid line) and the non-linear density dependence model (dashed line)
