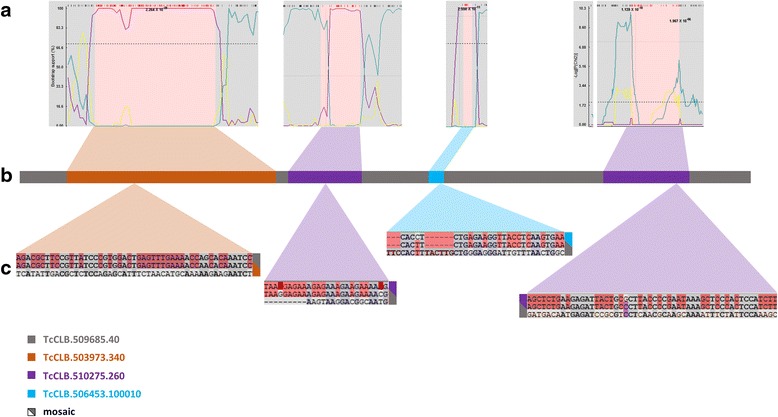
Fig. 5.

A mosaic TcTS gene showing evidence for recombination events and example sequence comparisons within each minor donor sequence. a BOOTSCAN and MAXICHI output showing alterations in bootstrap support and peak log(p(χ2)) values, respectively, at mosaic region boundaries. b The TcCLB.509685.40 mosaic gene with donor contributions indicated by colors. c Partial alignment of mosaic regions with respective donors. In each sequence triplet alignment, the middle sequence is the mosaic gene, shading highlights identical nucleotides of mosaic sequences with major (top) and minor (bottom) donor
