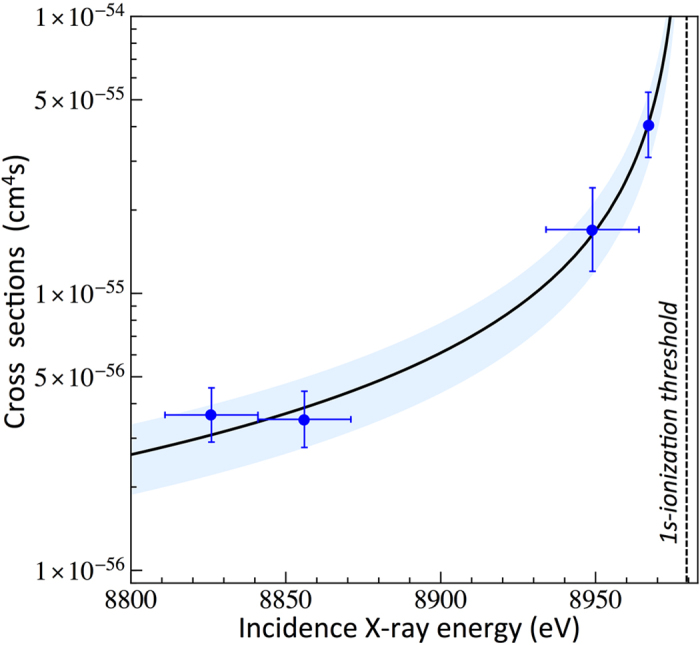
Figure 3. TPA cross-sections as a function of the incoming X-ray energy (blue circles).

The line is a result of fitting the OPA cross-section dependence to experimental data points. The blue area represents the uncertainties related to the TPA cross section curve.
