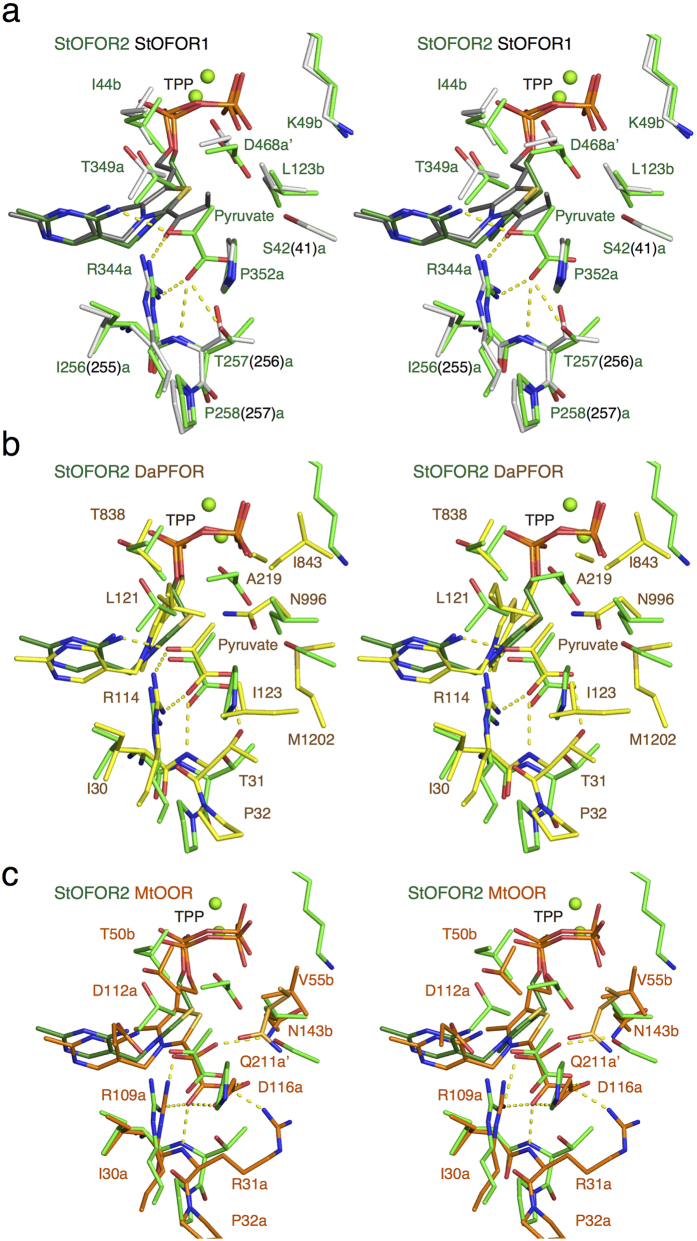
Figure 4.
(a) Comparison of the 2-oxoacid substrate binding site of StOFOR2 and StOFOR1. StOFOR2 and the bound TPP are shown in green and dark green, and StOFOR1 and the bound 1-hydroxypropyl TPP (post-decarboxylation state) are shown in white and gray, respectively. The residue numbers of StOFOR2 are shown, and those of StOFOR1 are shown in parentheses, if they are different. (b) Comparison of StOFOR2 (green) and DaPFOR (yellow). The residue numbers of DaPFOR are shown. (c) Comparison of StOFOR2 (green) and StOFOR1 (orange). The residue numbers of MtOOR are shown.

