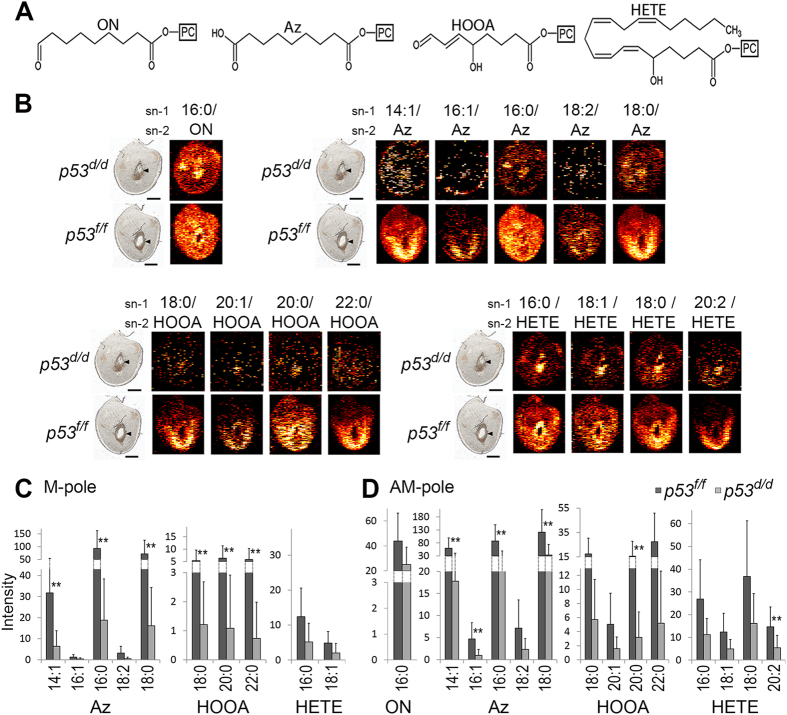
Figure 3. Intensities of selected Ox-PC species in p53f/f vs p53d/d implantation sites on day 8 of pregnancy.
(A) Structures of the sn-2 acyl chain of four groups of Ox-PC species. From left to right; oxononanoyl (ON)-PC, azelayl (Az)-PC, hydroxy-oxooct-enoyl (HOOA)-PC, and hydrox-eicosa-tetra-enoyl (HETE)-PC. (B) Ion images of Ox-PC species (the acyl group in the sn-1 position of the PC/the oxidized moiety in the sn-2 position). (C) M-pole data. (D) AM-pole data. The sn-1 position of each species is depicted where all Ox-PC species are significantly increased (p < 0.05) with ** for p-values < 0.01. Non-normalized data and potassium adducts are depicted. Table S4 contains the significance, average values, and standard deviations for these measurements.

