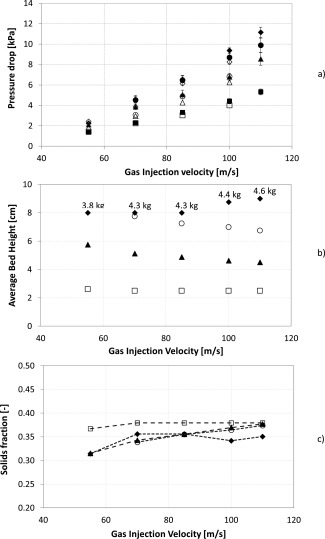
Figure 5.

(a) Measured (full symbols) and calculated (empty symbols) pressure drop over the rotating bed, (b) measured average bed height, and (c) corresponding calculated solids fraction. HDPE (ρ s = 950 kg/m3), d p = 1 mm.
At different solids capacities: 2 kg (□); 3 kg (Δ); 4 kg (○); Max capacity (⋄). The maximum capacity is indicated with labels for each gas injection velocity in Figure 5b. Error bars represent ± standard deviation based on three repeated experiments. A gas injection velocity change indicates a change of gas flow rate, given that the slot thickness is constant in all experiments.
