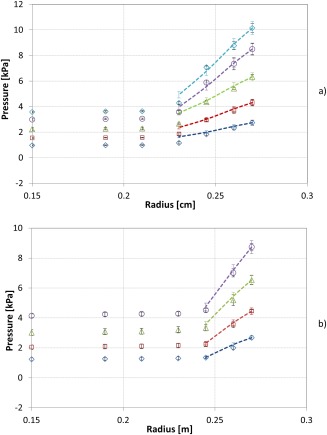
Figure 7.

Profiles of measured pressure in the GSVR (symbols) and calculated pressure over the bed using Eq. 11 (lines) for HDPE (ρ s = 950 kg/m3); (a) d p = 1.5 mm and 4 kg bed mass, (b) dp = 1 mm and 2 kg bed mass at 55 m/s (⋄); 70 m/s (□); 85 m/s (Δ); 100 m/s (○); 110 m/s (x).
The circumferential wall is at r = 0.27 m. Black error bars represent the standard deviation for measured values between three repeated experiments. Colored error bars represent the ±5% deviation from the calculated values. [Color figure can be viewed in the online issue, which is available at wileyonlinelibrary.com.]
