
Figure 2.
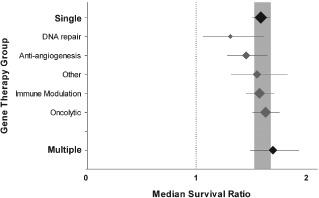
Stratification by gene therapy group. Grouping gene therapies into those using a single gene or those using multiple genes in a single vector did not account for between‐study heterogeneity (p > 0.0019, n = 387 and 40 respectively; black plots with bold labels). Furthermore, subcategorizing the single gene group by the broad mechanism of action of that gene did not account for between‐study heterogeneity (p < 0.0019, grey plots). Plots represent mean ± 95% confidence interval (CI) and the diamond represents a measure of number of comparisons within each stratum. The dotted line represents the level of neutral treatment effect.