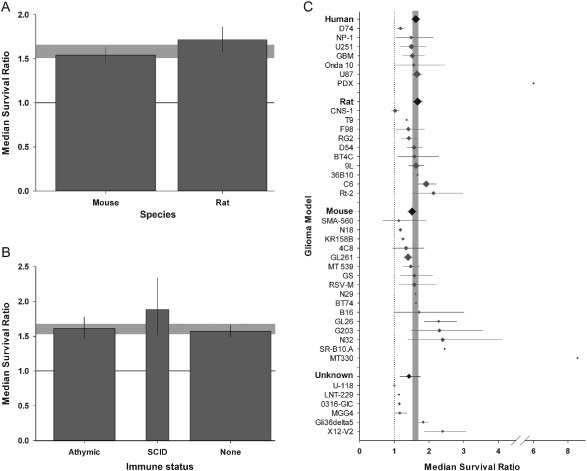
Figure 5.

Glioma model setup. A. Gene therapy in rats was associated with greater efficacy than in mice (p < 0.0019). B. Immune status was associated with heterogeneity: use of animals with severe combined immunodeficiency were associated with greater efficacy than athymic or normal counterparts (p < 0.0019). The grey bands represent global 95% confidence intervals (CIs); columns represent mean ± 95% CI and column width a measure of number of comparisons within each stratum. The solid line represents the level of neutral treatment effect. C. Glioma model was associated with between‐study variance (p < 0.0019), with greatest efficacy seen with N32 and G203 lines in the complete dataset. Furthermore, the species of tumour origin was associated with heterogeneity (p < 0.0019). The grey band represents global 95% CIs; plots represent mean ± 95% CI and the diamond represents a measure of number of comparisons within each stratum. The dotted line represents the level of neutral treatment effect.
