
Figure 1.
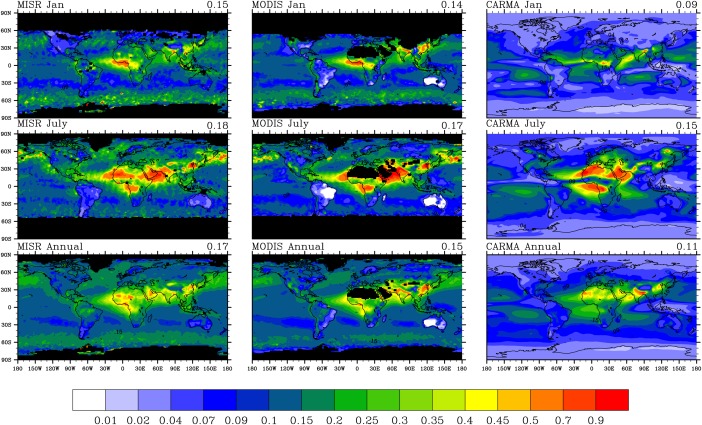
AOD global maps for (top row) January, (middle row) July, and (bottom row) annual average; MISR observations (550 nm) are shown in left column; MODIS observations (550 nm) are shown in middle column; CARMA simulations (532 nm) are shown in right column. Both observations, and the model are averaged from 2009 to 2011 with calculated global mean AOD shown on the right top of each figure. Missing values are denoted by black shading. For the global mean AOD from CARMA we have only averaged over the same area of the planet that is observed by the MISR.