Figure 3.

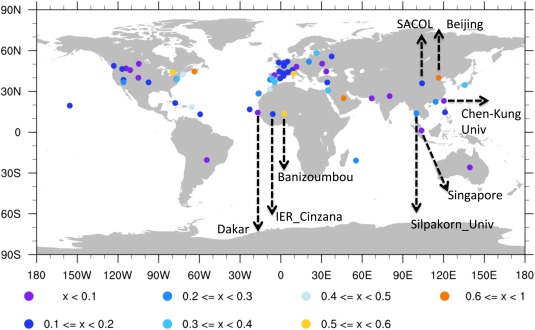
Annual column AOD at midvisible wavelength over 75 AERONET sites averaged from 2009 to 2011. Colors of cycles correspond to AOD values as shown in the legends. Sites marked are further discussions in Table 2.

Annual column AOD at midvisible wavelength over 75 AERONET sites averaged from 2009 to 2011. Colors of cycles correspond to AOD values as shown in the legends. Sites marked are further discussions in Table 2.