
Figure 4.
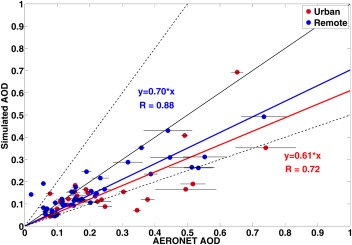
AOD (midvisible wavelength) simulations compared with data from 72 AERONET sites from 2009 to 2011. Blue (red) line is fitted line forced thru the origin for rural (urban) sites, 1:1 line is shown in solid black, 1:2 and 2:1 lines are shown in dashed black. Urban sites are denoted by red circles, while rural or remote sites are denoted by blue circles. Error bars denote year‐to‐year variability of observations.