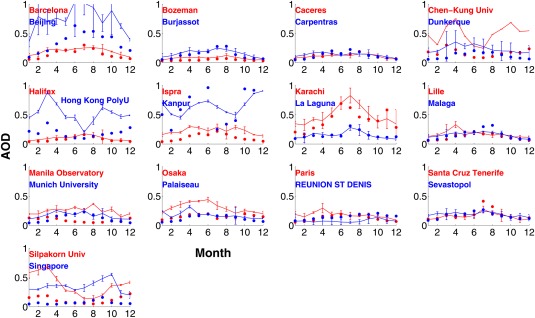
Figure 5.

AERONET monthly AOD at midvisible wavelengths at selected urban/suburban sites averaged from 2009 to 2011 (solid lines); model simulations (solid dots). Error bars indicate standard deviation of 3 years of data for each month. Each figure contains monthly AOD data at two sites marked by red and blue colors, respectively, with the site names listed in each figure.
