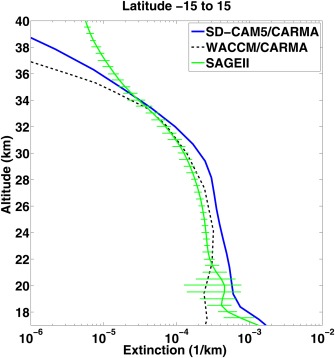
Figure 19.

SAGEII extinction [Chu et al., 1989] at 525 nm in the tropics (15°S–15°N) from 17 to 40 km in altitude is shown by the green line, pure sulfate extinction simulated by WACAM/CARMA is shown in dashed black line [English et al., 2011], CESM1/CARMA simulated aerosol extinction at 533 nm is shown in solid blue line including mixed particles, and pure sulfates. The mixed particles contain significant organics below 20 km, as shown in Figure 15.
