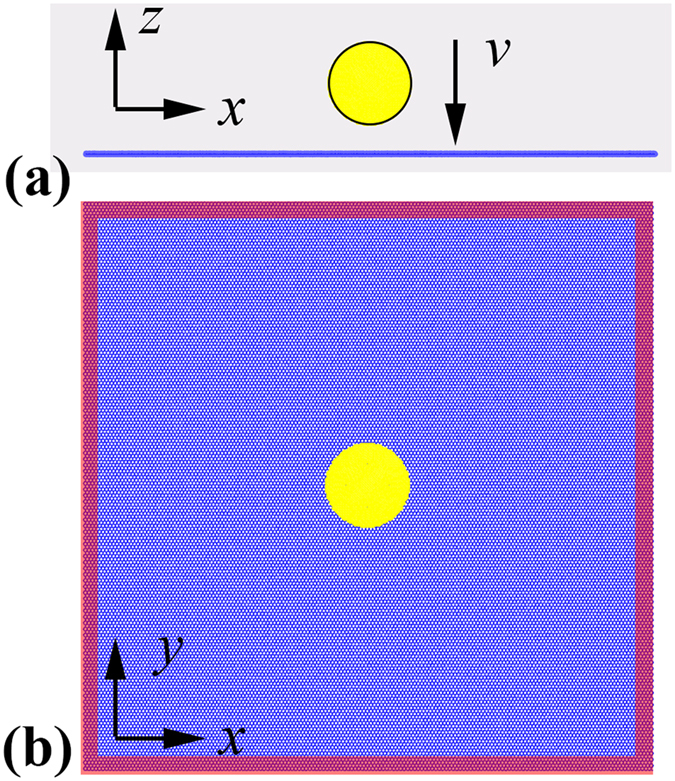
Figure 1. Schematic view of the impact simulation setup.

Upper is the front view and bottom is the top view. The red regions represent the fixed boundaries during impact.

Upper is the front view and bottom is the top view. The red regions represent the fixed boundaries during impact.