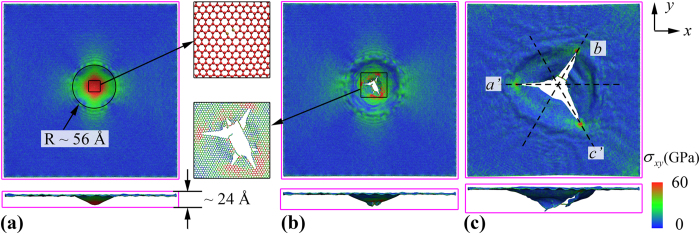
Figure 4.
Planar stress (σxy) distribution of the square graphene membrane with two fixed edges (in x direction) at the simulation time of: (a) 4.6 ps, inset shows the initial crack which is similar as that observed from its counterpart with all edges fixed in inset of Fig. 3a, (b) 5.1 ps, inset shows the existences of monoatomic chains, and (c) 7.9 ps, which shows the final failure shape of graphene membrane, and the dashed lines illustrate the crack orientations.

