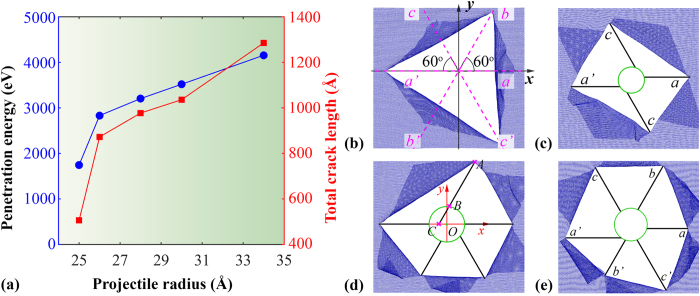
Figure 6.
(a) Penetration energy and the total crack length as a function of projectile radius; Atomic configurations of the graphene membrane showing the final failure shape induced by the projectile with a radius of: (b) 25 Å, (c) 26 Å, (d) 28 Å, and (e) 34 Å. Figure b shows the six preferential crack directions denoted by (a, a’), (b, b’) and (c, c’). Figure d schematically illustrates the geometrical relations between the crack tip A (x1, y1), and the intersections B (x2, y2) and C. Here, distance AC is defined as the ideal crack length, and BC is referred as the melt crack length. Solid dark lines in Figure c, d, and e schematically show the cracks formed after impact, and the green circles represent the projectile. To note that the atomic configurations have been scaled to a similar size, which do not reflect the actual size of the sample and the projectile.

