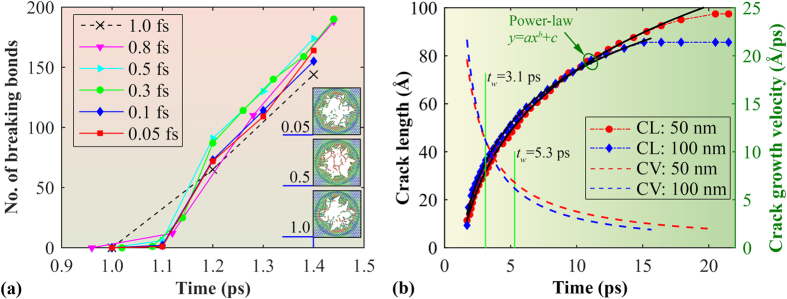
Figure 8.
(a) Number of breaking bonds in the graphene membrane as a function of time during the initial penetration under different time steps (with a projectile velocity of 6 km/s, sample size 50 × 50 nm2). Insets show the atomic configurations of the graphene membrane (in the penetration region) at the simulation time of 1.4 ps under the time step of 0.05, 0.5 and 1.0 fs, respectively. (b) Crack length (in c direction) and crack growth velocity as a function of time for the graphene membrane under a projectile velocity of 6 km/s. CL and CV represent crack length and crack growth velocity, respectively. Here, the crack length is estimated by tracking the number of breaking bonds during the whole simulation. The two solid green lines highlight the approximate time when the first stress wave bounced back to the impact centre.

