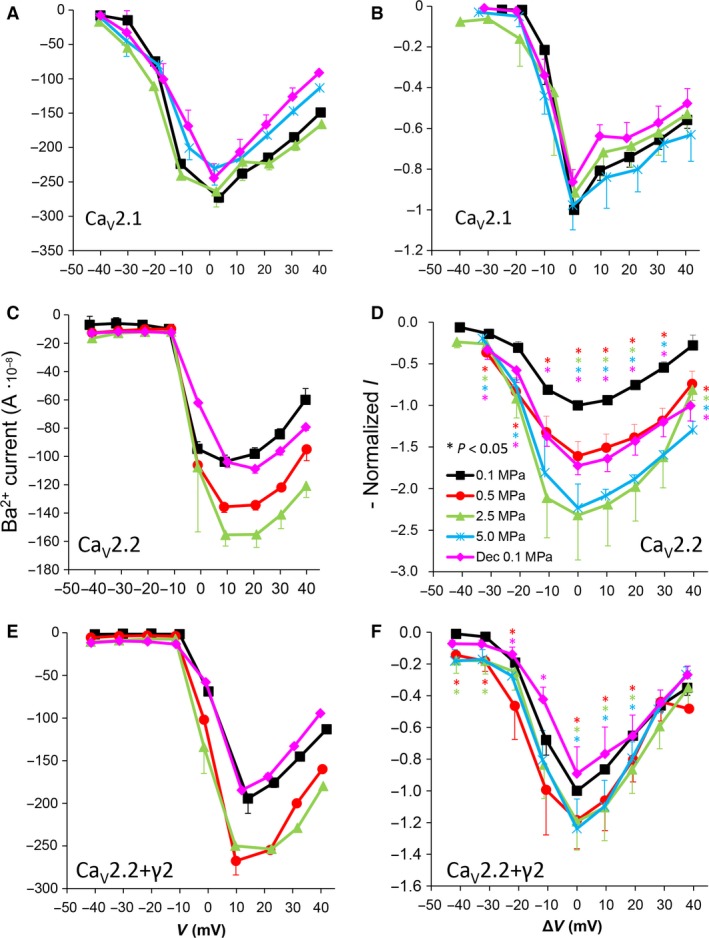
Figure 2.

I‐V curves of maximal currents. (A and B) CaV2.1, (C and D) CaV2.2, (E and F) CaV2.2+γ2 channels. (A, C and E) I‐V curve of a single oocyte. (B, D and F) Pooled data from 7–9 (B), 9–12 (D) and 7–10 (F) oocytes exposed to 0.5–5.0 MPa pressure (colour indicated), normalized to maximal current at 0.1 MPa, holding potential is adjusted [ΔV (mV)] so that 0 indicates the potential at which maximal current is obtained (VImax). Statistical significance for each point on the curve is indicated by corresponding colour asterisks (P < 0.05). Dec indicates decompression.
