
Figure 6.
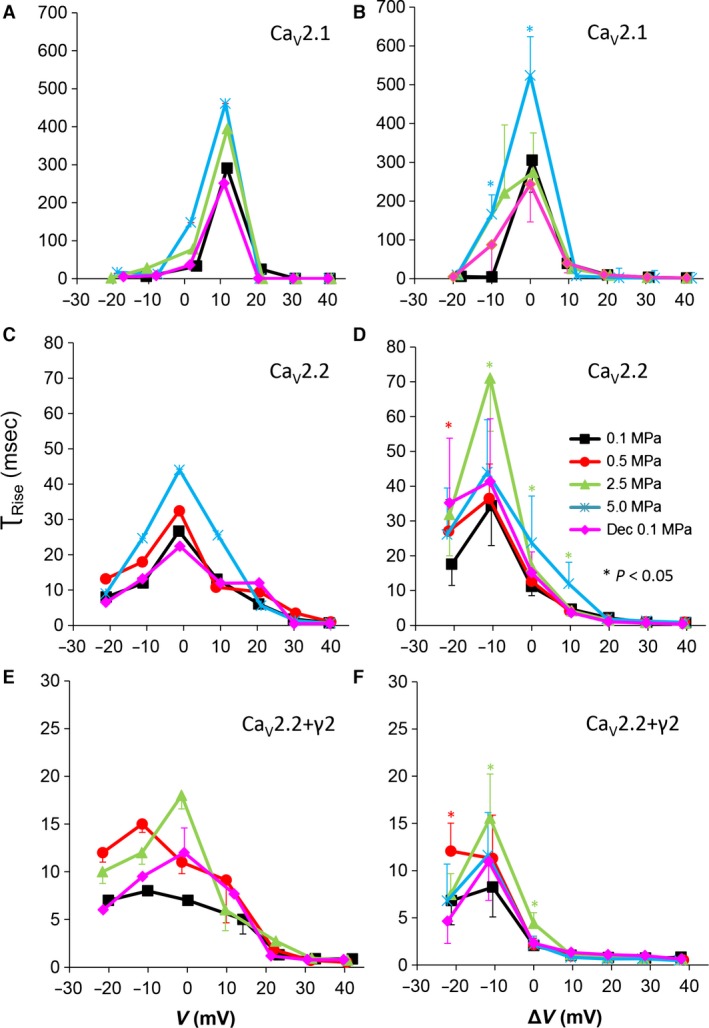
Time constant of current activation (τRise) at various pressures. (A and B) CaV2.1, (C and D) CaV2.2 and (E and F) CaV2.2+γ2 channels. (A, C and E) τRise measured in a single oocyte. (B, D and F) Pooled data of τRise, n as stated in Figure 2. Pressures are colour indicated. Statistical significance for each point on the curve is indicated by corresponding colour asterisks. Holding potential is expressed [ΔV (mV)] as in Figure 2. Dec indicates decompression.