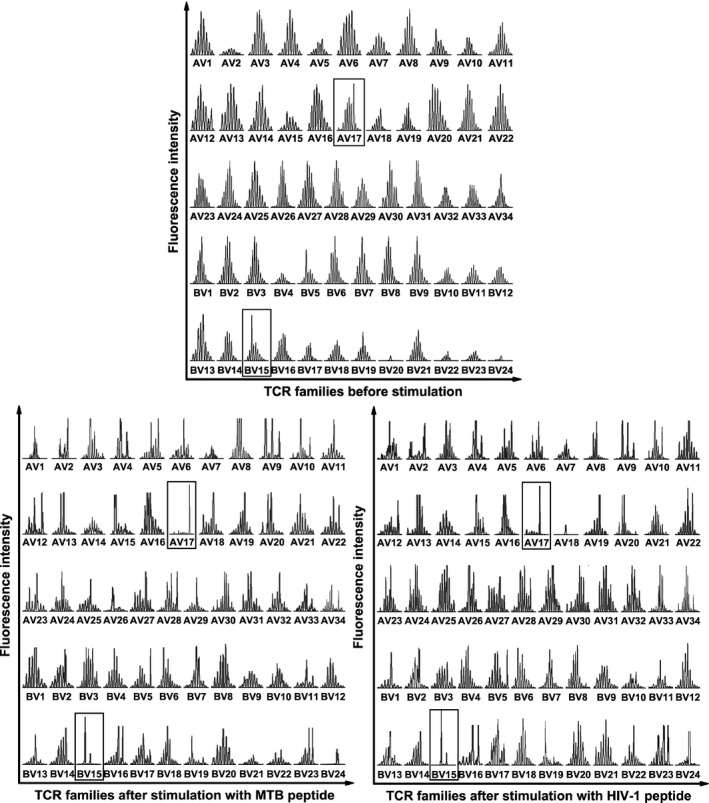
Figure 1.

CDR3 spectratypes of 34 TCR Vα and 24 Vβ gene families of CD8+ T cells before and after antigen peptide stimulation. Both spectratypes of the MTB Ag85B199‐207 (KLVANNTRL) peptide‐stimulated CD8+ T cells and of the HIV‐1 Env120‐128 (KLTPLCVTL) peptide‐stimulated CD8+ T cells showed single peaks in TCR Vα17 and Vβ15 gene families (framed) after stimulation, indicating its specificity for corresponding peptides. AV, TCR Vα‐chain; BV, TCR Vβ‐chain.
