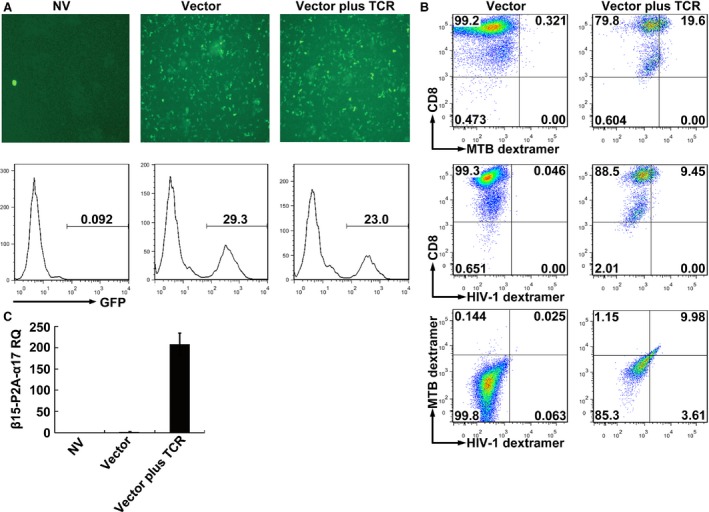
Figure 3.

Expression of exogenous TCRs after genetic transferring TCR genes into CD8+ T cells. (A) GFP expression was observed under fluorescence microscope and analysed by FACS. (B) Flow cytometric analysis of CD8+ T cells 5 days after retroviral transduction. Cells were stained with PE‐Cy7‐anti‐CD8, PE‐Ag85B199‐207/HLA‐A*0201 dextramer and APC‐Env120‐128/HLA‐A*0201 dextramer. The data were analysed within the GFP‐positive population. (C) Quantitative RT‐PCR analysis of mRNA expression of β15‐P2A‐α17 genes. NV, transduced with no vector; Vector, transduced with empty vector only carrying the GFP gene; Vector plus TCR, transduced with vector carrying the GFP gene and MTB Ag85B199‐207‐ and HIV‐1 Env120‐128‐bispecific TCR gene; MTB dextramer: PE‐Ag85B199‐207/HLA‐A*0201 dextramer; HIV‐1 dextramer: APC‐Env120‐128/HLA‐A*0201 dextramer; RQ: relative mRNA expression normalized to GAPDH.
