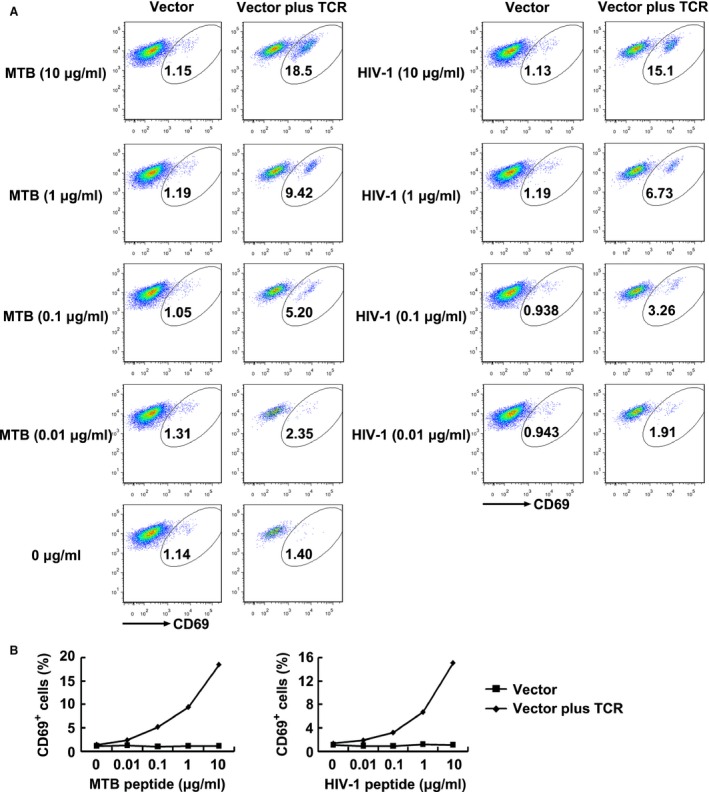
Figure 7.

CD69 expression of TCR‐transduced J.RT3‐T3.5 cells in response to antigen peptides stimulation. (A) Shown are the resultant FACS scatter plots for CD69 expression on J.RT3‐T3.5 cells transduced with empty vector or TCR vector within the GFP‐positive population. Cells were cocultured with T2 cells pulsed with serial dilutions of Ag85B199‐207 or Env120‐128 peptide. (B) Shown are the line charts analysed for the FACS scatter plots. MTB peptide: Ag85B199‐207 peptide; HIV‐1 peptide: Env120‐128 peptide. Vector: J.RT3‐T3.5 cells transduced with empty vector; Vector plus TCR: J.RT3‐T3.5 cells transduced with TCR vector.
