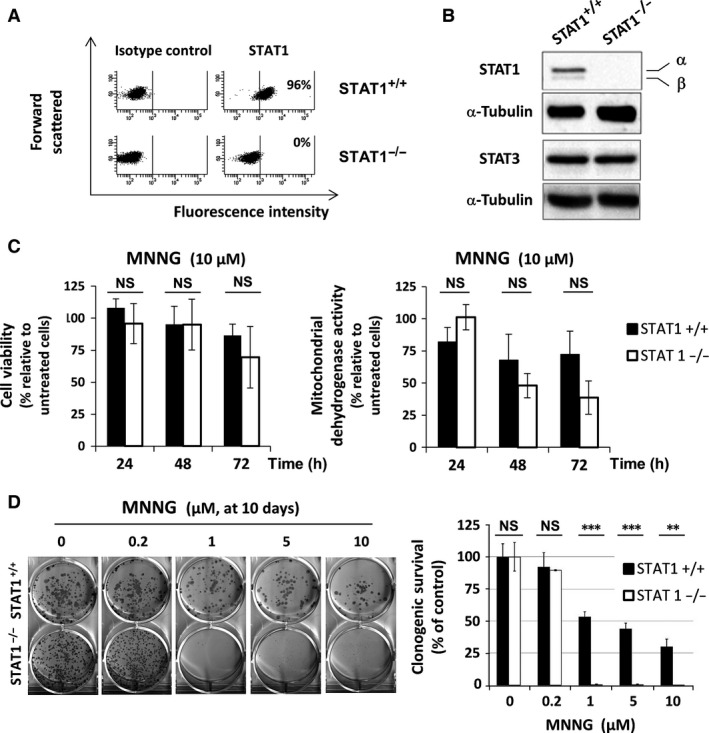
Figure 1.

Cellular response to MNNG according to STAT1 expression. STAT1 expression was analysed: (A) by flow cytometry (the proportion of cells expressing STAT1 is indicated for each cell line), (B) by western blotting (α‐Tubulin and STAT3 were also assayed as controls), (C) Cells were exposed to 10 μM MNNG for 1 hr. At the indicated times, cell viability was assessed by Trypan blue vital staining (left panel) and cell dehydogenase activity was analysed by MTS assay (right panel). Results are plotted as percentage relative to untreated cells at the same time‐points. Data are from three independent experiments. Error bars represent the standard deviation (NS, non‐significant). (D) Long‐term clonogenic survival was analysed 10 days following a 1 hr exposure to the indicated doses of MNNG. A typical clonogenic assay representative of three independent experiments is shown. Percentage of colonies containing 50 cells or more was evaluated relative to untreated control. Statistical significance was determined by paired t‐test (***P < 0.001; **P < 0.01).
