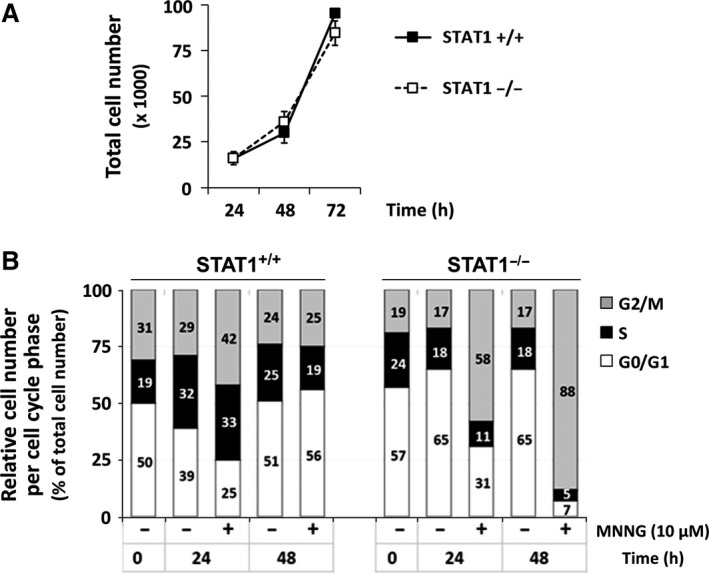
Figure 3.

G2/M accumulation following MNNG exposure in the absence of STAT1. (A) Proliferation curves of STAT1+/+ and STAT1−/− cells. Error bars represent the standard deviation. Experiment conducted in triplicate and repeated twice. (B) STAT1+/+ and STAT1−/− cells were treated or not for 1 hr with 10 μM MNNG. At the indicated times, cells were fixed, stained with propidium iodide and analysed by flow cytometry. Cumulative plots and numbers indicate the relative percentages of cells present in each of the three phases of the cell cycle. A typical experiment out of two is shown.
