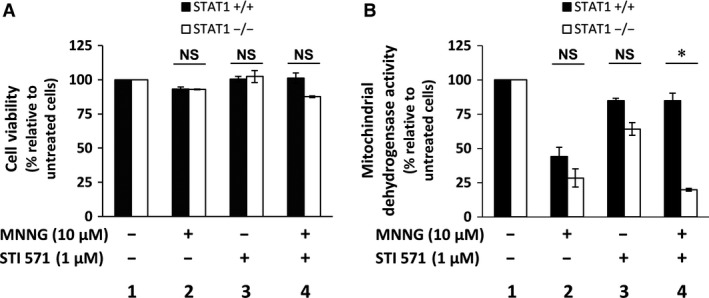
Figure 6.

STI571 impacts on MNNG‐induced cytotoxicity according to STAT1 expression. STAT1+/+ and STAT1−/− cells were exposed (+) or not (−) to 10 μM MNNG for 1 hr in the presence (+) or not (−) of 1 μM STI571 inhibitor. Viability was studied after 72 hrs by Trypan blue vital coloration (A) and cell dehydrogenase activity by MTS assay (B). Results are plotted as the percentage relative to untreated cells. Data points are the mean of triplicates. Error bars represent the standard deviation. These experiments were repeated twice and statistical significance was determined using the Wilcoxon signed‐rank test (NS, non‐significant; *P < 0.05).
