
Figure 3.
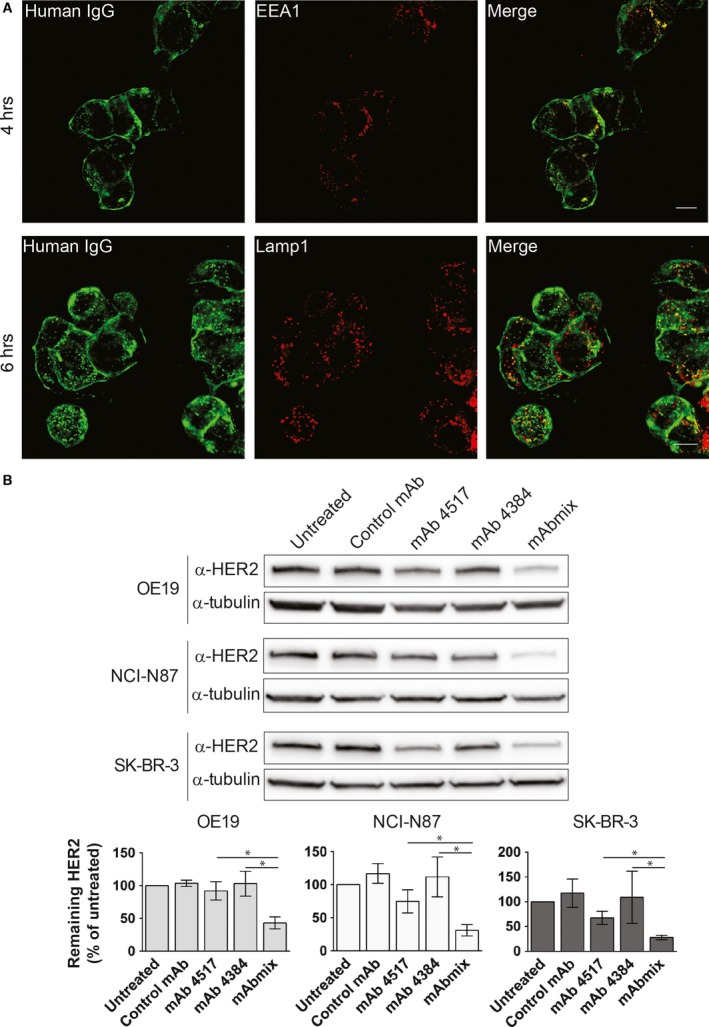
The mAb mixture induces degradation of HER2 via a classic endocytic degradative pathway. (A) OE19 cells were incubated in growth medium containing the mAb mixture for 4 or 6 hrs, before fixation, permeabilization and immunostaining with antibodies to human IgG. Early endosomes were identified by staining for EEA1 and late endosomes/lysosomes were identified by staining for Lamp1. One representative experiment out of three is shown, scale bars: 10 μm. (B) OE19, NCI‐N87 and SK‐BR‐3 cells were incubated in growth medium without mAbs (Untreated) or with negative control mAb, mAb 4517, mAb 4384 or the combination of mAb 4517 and mAb 4384 (mAbmix) for 24 hrs, before lysis and immunoblotting using an antibody to HER2 (clone 42). Blotting for tubulin was used as loading control. One representative experiment of three is shown. Net luminescence of the bands corresponding to HER2 was quantified and normalized to the loading control, and average values of at least three independent experiments ±S.D. were plotted as percentage of HER2 in untreated cells. Statistical analysis revealed P < 0.05 in all three cell lines when comparing mAbmix versus mAb 4517 or mAb 4384.