Figure 2.

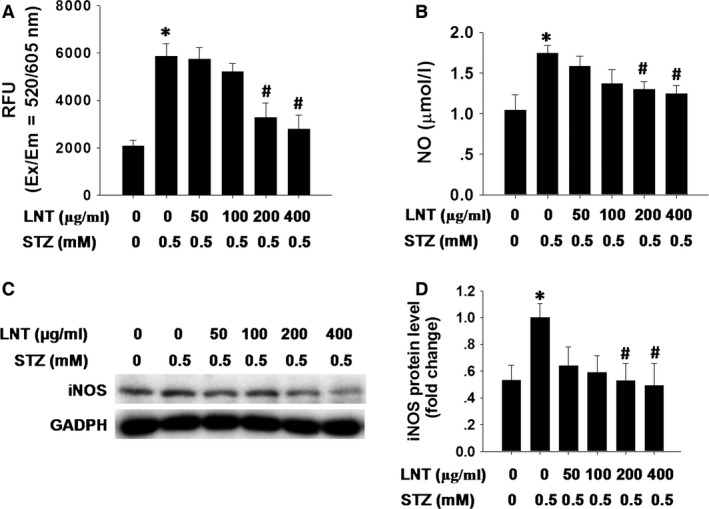
Effect of LNT on STZ‐induced ROS accumulation, nitric oxide synthesis and iNOS expression in INS‐1 cells. (A) Following pre‐incubation with LNT for 30 min., INS‐1 cells were treated with the indicated concentrations of LNT and STZ (0.5 mM) for 24 hrs. Intracellular ROS measured with Cellular Reactive Oxygen Species Detection Assay Kit (Red Fluorescence). The fluorescence signal was monitored at Ex/Em = 520/605 nm (cut‐off = 590 nm) with bottom read mode. (B) Cells were treated with different concentrations of LNT in the presence or absence of 0.5 mM STZ for 24 hrs. Nitric oxide production was then detected. (C and D) INS‐1 cells were treated as in B, and the protein level of iNOS was determined by Western blot analysis. *P < 0.05 compared to the untreated control group; # P < 0.05 compared to the STZ group.
