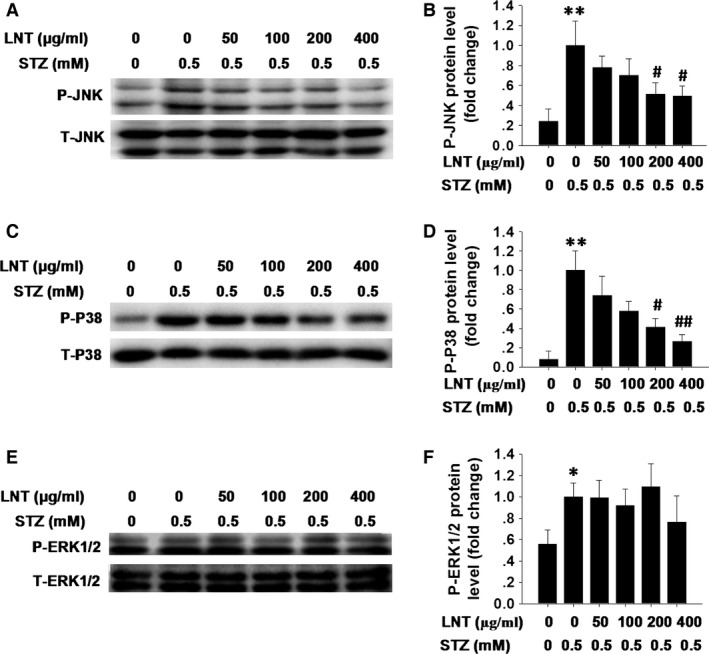
Figure 3.

Effect of LNT on STZ‐induced JNK and p38 MAPK activation in INS‐1 cells. (A) Following pre‐incubation with LNT for 30 min., the cells were treated with the indicated concentrations of LNT and STZ (0.5 mM) for 24 hrs. Phospho (P‐JNK) and total (T‐JNK) form of JNK were analysed by Western blot assay. (B) Quantitative analysis of phosphorylation of JNK was detected as in A. (C) INS‐1 cells were treated as in A, and the phosphorylation of p38 MAPK (P‐P38) was determined by Western blot analysis. (D) Quantitative analysis of P‐P38 was detected as in C. (E) INS‐1 cells were treated as in A, and the phosphorylation of ERK1/2 (PERK1/2) was determined by Western blot analysis. (F) Quantitative analysis of phosphorylation of ERK1/2 was detected as in E. The data are presented as the means ±S.E.M. for three independent experiments. *P < 0.05, **P < 0.01 compared to the untreated control group; # P < 0.05, ## P < 0.01 compared to the STZ group.
