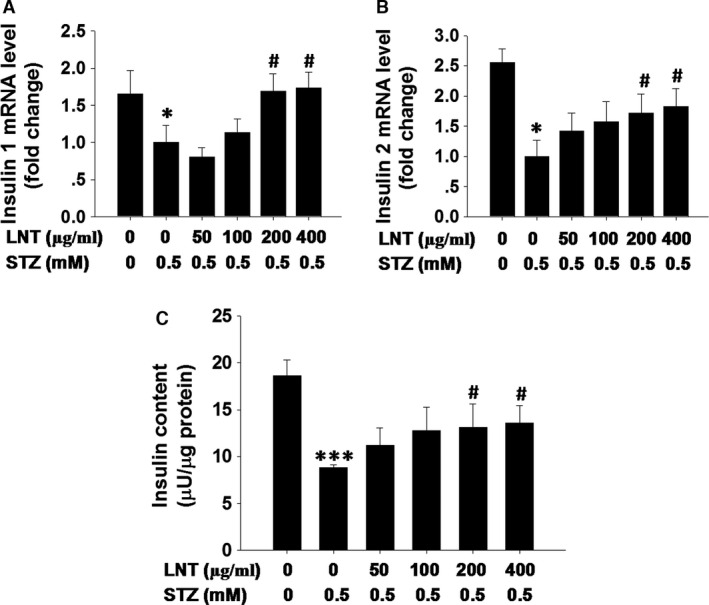
Figure 5.

Effect of LNT on insulin synthesis in STZ‐treated INS‐1 cells. (A and B) Real‐time PCR analysis was performed to measure the level of insulin 1 (A) and insulin 2 (B) after treatment with indicated regents. (C) Cells pre‐treated with the indicated concentration of LNT for 30 min. were incubated with or without 0.5 mM STZ for 24 hrs. Insulin content was measured after acidified ethanol extraction. *P < 0.05, ***P < 0.001 compared to the untreated control group; # P < 0.05 compared to the STZ group.
