Figure 3.

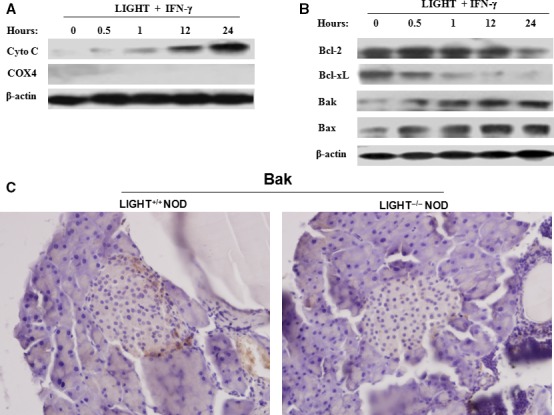
Increased release of cytochrome c and alterations in Bcl‐2 family members expression in LIGHT and IFN‐γ‐induced apoptosis of MIN6 cells. Cells were treated with LIGHT (5 μg/ml) and IFN‐γ (100 ng/ml) in combination for the indicated times. Cells were harvested and cytoplasmic protein was extracted. (A) Cytochrome c release was evaluated by Western blot. Cytochrome oxidase subunit IV (COX4), located exclusively in the mitochondria, was used here to confirm whether the cytoplasmic protein fractions included mitochondrial proteins. (B) The expression of Bcl‐2, Bcl‐xL, Bak and Bax was measured by Western blot. Equal protein loading in each lane was confirmed by probing the blots with anti‐β‐actin antibody. Data are representative of two‐independent experiments. (C) The expression of Bak in primary islets of 20‐week‐old female LIGHT +/+ and LIGHT −/− NOD mice was measured by immunohistochemisty. Magnification, 200×.
