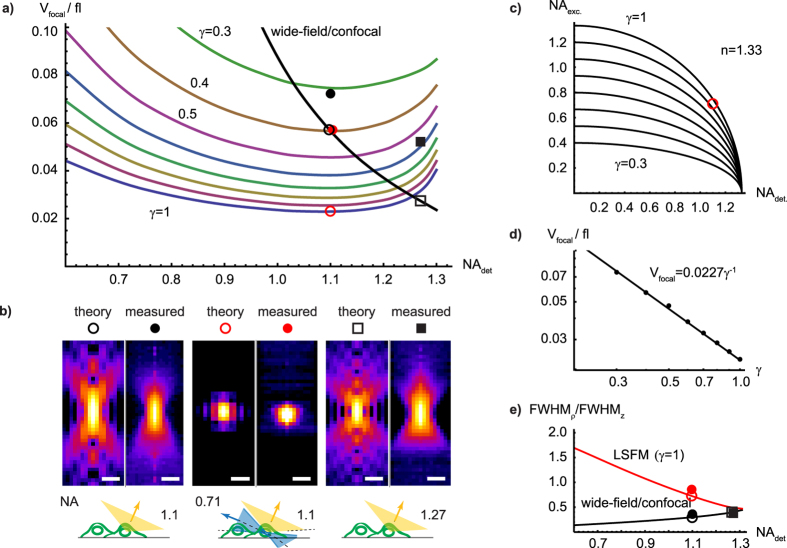
Figure 2. Effective focal volume and anisotropy.
(a) Effective focal volume element calculated for wide-field/confocal and light-sheet microscopes as a function of detection NA and various angular fill factors γ. Symbols indicate theoretical and estimated volumes of the PSFs presented in (b). (b) PSF comparison. Theoretical and measured PSF (x-z, log-scale, radially averaged) for the used 1.1 NA detection objective (left panels), the πSPIM with 1.1 detection and 0.71 excitation light-sheet NA (γ ≈ 1) (panels in the center). Panels to the right: for purpose of comparison, theoretical and measured PSF of the highest currently available water immersion) NA of 1.27. Bars, 500 nm. Focal volumes are from left to right about 0.057, 0.072, 0.023, 0.057, 0.027, 0.052 fl (theory, measured) and indicated in (a). (c) Excitation NA as a function of detection NA and angular fill-factor γ for water immersion set-ups (n = 1.33). (d) Minimal focal volume as a function of angular fill factor γ (e) Resolution anisotropy (FWHMρ/FWHMz) as a function of detection NA for γ = 1. Symbols indicate theoretical and measured anisotropies of the PSFs presented in (b).

