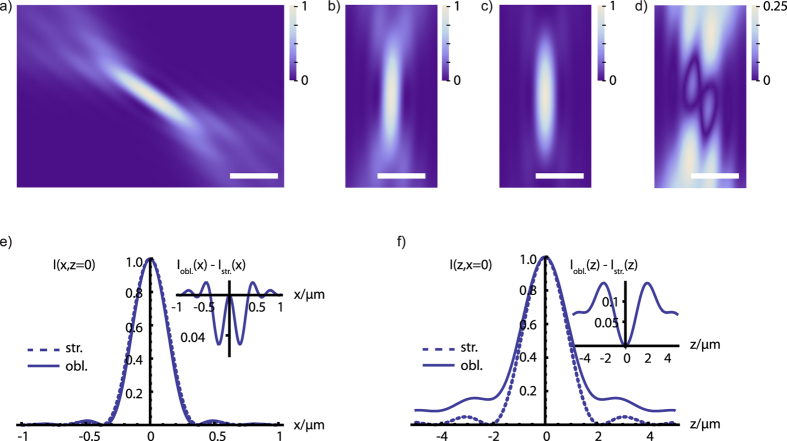
Figure 3. Comparison of oblique and straight light-sheet intensity distributions.
Theoretical intensity distributions I(x, z) of (a) the oblique light-sheet (θ0 = 57.5°), (b) rotated version of (a). (c) the straight light-sheet (θ0 = 0°) intensity distribution (with λ = 500 nm, n = 1.52, and θNA = 32.5°). (d) Absolute difference between oblique and straight light-sheet intensities. Please note that the scaling of this image is different (4×, indicated by the scale bar) in order to visualize the differences between oblique and strait light-sheet better. Bars, 500 nm. Comparison of the lateral (e) and axial (f) intensity profiles for the oblique (obl.) and straight (str.) light-sheet intensity distributions in (b,c). Insets show the absolute difference between the profiles.

