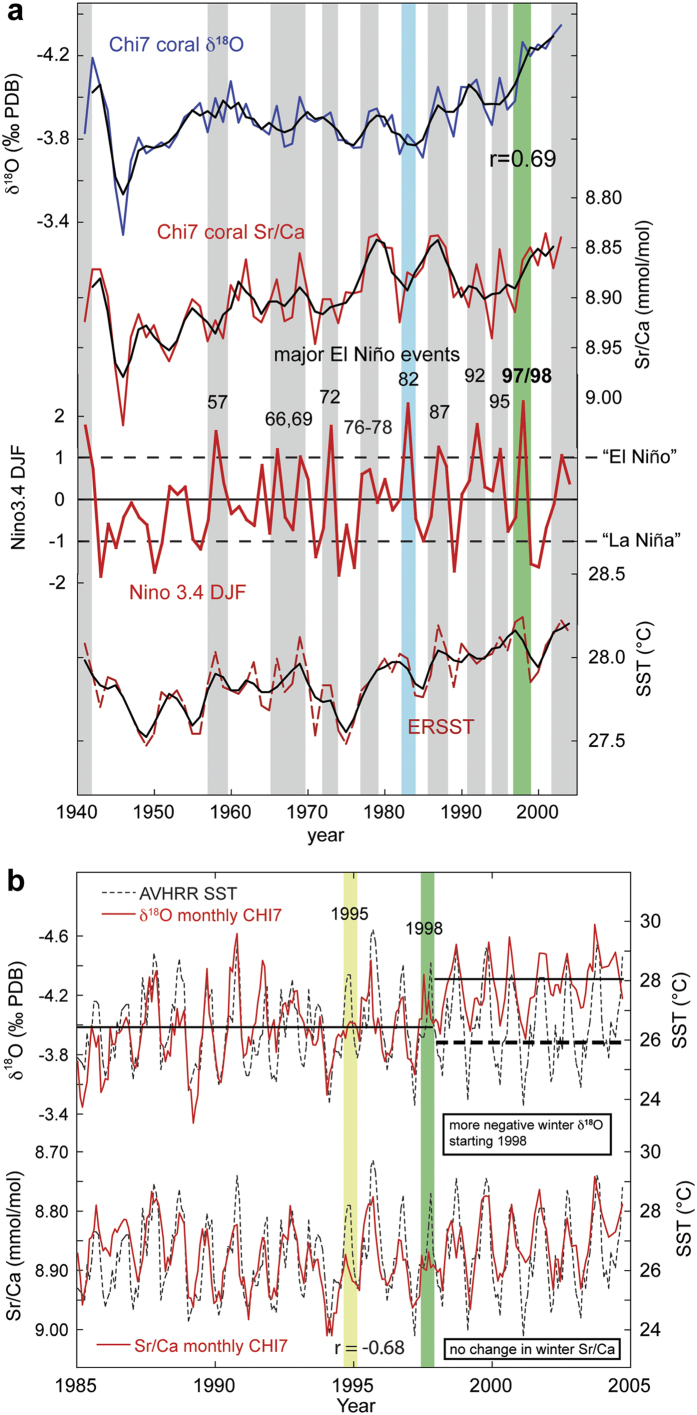
Figure 2. Geochemical coral proxies (δ18O, Sr/Ca) compared to major El Niño events and water temperature.
(a) Niño3.4 DJF index (red), grey bars indicate major El Niño events; green bar highlights record 1997/98 event, blue bar - 1982 El Niño. SST (red dashed, 9–11°N, 67°W) from ERSST.v3b dataset49. Colored lines depict annual resolution, black lines 3-year running averages. (b) Monthly coral δ18O (top) and Sr/Ca (bottom) compared to high-resolution satellite SST for the study site. Monthly SST (dashed, 10.5–11°N, 67–67.5°W) derived from 4 km spatial resolution Advanced Very High Resolution Radiometer (AVHRR) Pathfinder Version 5 SST dataset (http://www.nodc.noaa.gov/sog/pathfinder4km/). Solid lines in upper panel depict the average coral δ18O before and after 1998, dashed bold line indicates limit of winter coral δ18O after 1998.

