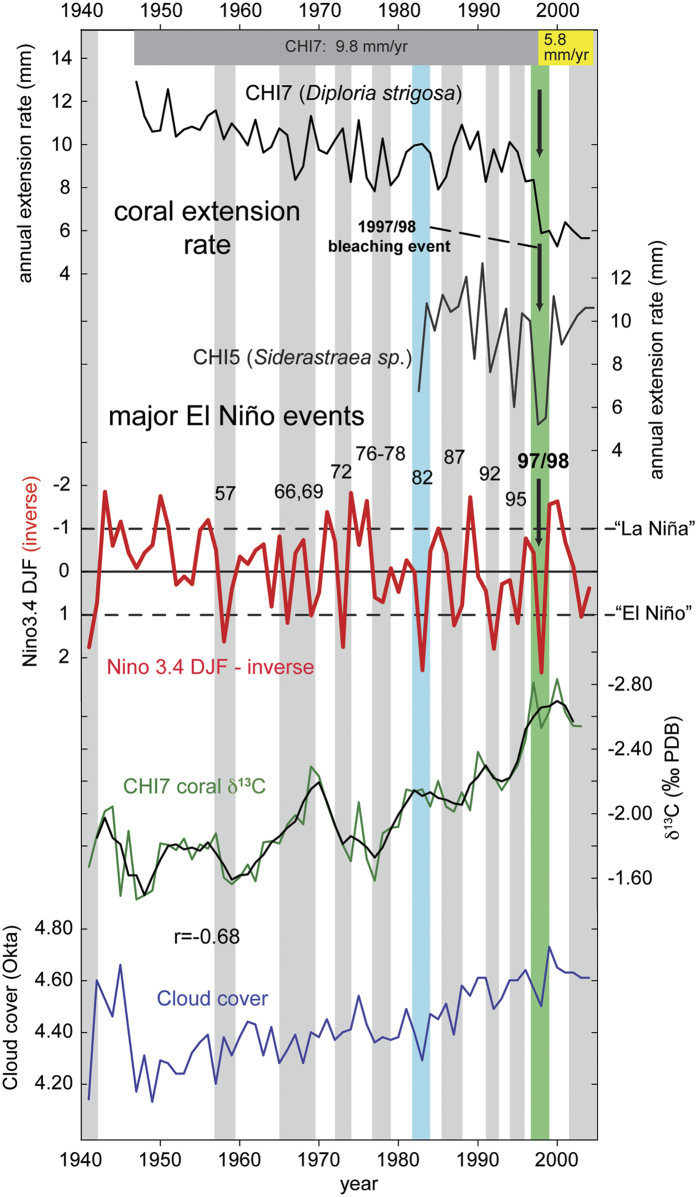
Figure 3. Coral annual extension rates and their relation to major El Niño events.
Note: Niño3.4 DJF index (red) plotted inversely, grey bars indicate major El Niño events; green bar highlights record 1997/98 event. Extension rates derived from analysis of X-radiographies of coral slabs (cores CHI 5 and 7). All data in annual resolution. Grey and yellow bars in top panel show average annual extension rates for core CHI7 for the respective time intervals. Lower plots: Coral δ13C; Cloud cover (10–14°N, 66–68°W, ICOADS data by NOAA/OAR/ESRL PSD, http://www.esrl.noaa.gov/psd/).

