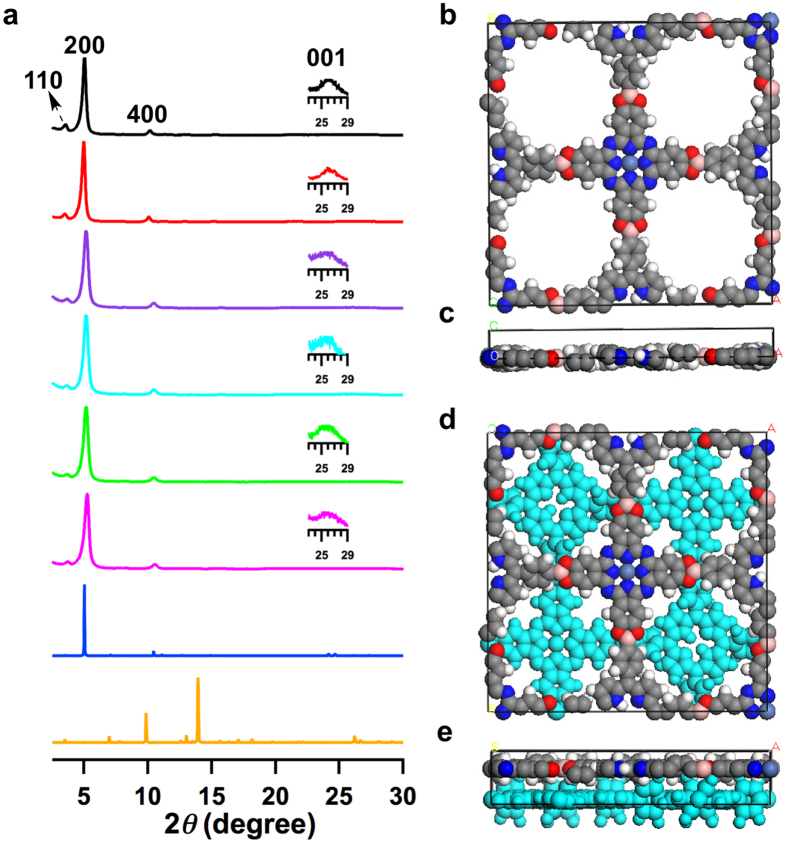
Figure 2. Crystalline structures of microporous 2D porphyrin-co-phthalocyanine COFs.
(a) Experimentally observed XRD patterns (black curve for H2TPP-NiPc-COF, red curve for H2DPP-CuPc-COF, purple curve for ZnTPP-NiPc-COF, sky-blue curve for ZnTPP-CuPc-COF, green curve for CuTPP-NiPc-COF and magenta curve for CuTPP-CuPc-COF) and patterns simulated with the eclipsed AA stacking (blue curve) for H2TPP-NiPc-COF and with the AB-staggered stacking (orange curve) for H2TPP-NiPc-COF. (b,c) Views of the unit cell along the z (b) and y (c) axes of H2TPP-NiPc-COF. (d,e) Views of the AB-staggered unit cell along the z (d) and y (e) axes. Insets in XRD profiles show the enlarged views of the (001) peaks.

