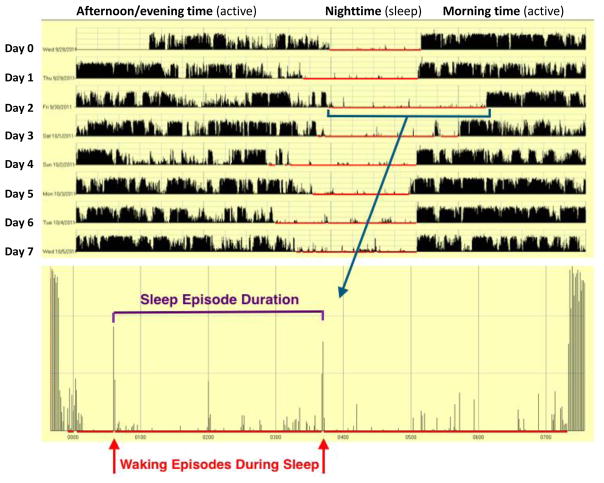
Figure 1. Example of sleep actigraphy from a study subject.
Actigraph tracing from a 7-day study period (time along x-axis), and measured activity (y-axis) Sleeping hours (red) are magnified to show detail, with waking episodes during sleep (red arrows) are recorded via patterned movement. Sleep episode duration (purple interval) is defined by the time between waking episodes.

