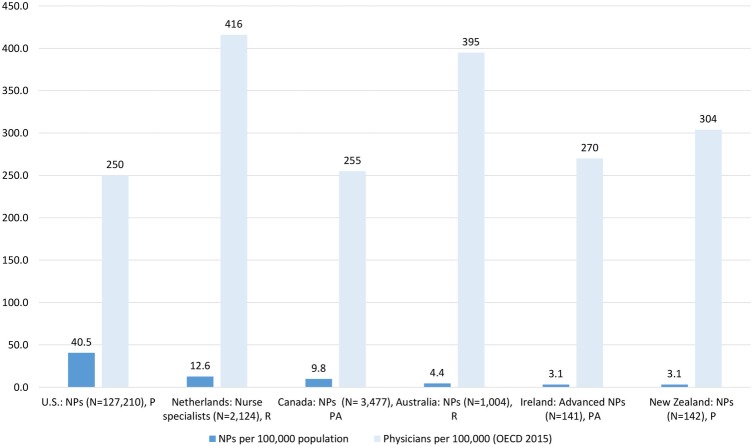
Figure 2.
NP density compared with physicians per 100 000 population, 2013*. Sources: Authors' calculations, based on the following data sources (Dutch Nurse Specialist Registry. Unpublished data on Nurse Specialists (Verpleegkundig Specialisten), 2009 to 2015, received upon request. 2015).37 51–55 Data on physicians based on the OECD 2015 database,45 drawn from the following primary data sources: USA: AMA; Canada: CIHI; the Netherlands: The BIG register, Australia: AIHW, New Zealand: Medical Council Medical Register.56 57 Notes: *year 2013; except for Ireland (2014), USA (2012) depending on years covered by OECD physician data. Caveats: the Netherlands (nurse specialists): an estimated 12 test accounts are in the database that cannot be filtered out (personal communication, with registry advisor at Verpleegkundig Specialisten Register, 29 January 2016). AIHW, Australian Institute of Health and Welfare; AMA, American Medical Association; CIHI, Canadian Institute for Health Information; N, total number; NPs, nurse practitioner; OECD, Organisation for Economic Cooperation and Development; P, practising; PA, professionally active; R, registered/licensed to practice.

