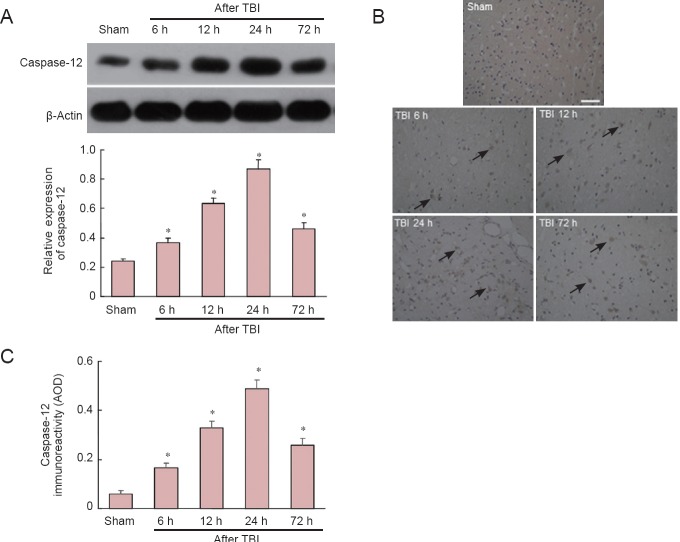
Figure 2.
Time course of caspase-12 expression in penumbra at 6, 12, 24 and 72 hours (h) after traumatic brain injury (TBI).
(A) Western blot. Optical density of caspase-12 bands was normalized to that of β-actin. (B) Representative photomicrographs showing elevated immunoreactivity of caspase-12 in traumatic penumbra compared with sham-operated rats. Arrows: Caspase-12-positive cells. Bar: 50 μm. (C) Quantification of caspase-12 immunoreactivity in traumatic penumbra normalized to average optical density (AOD). Data are expressed as the mean ± SD; n = 6 rats per group. *P < 0.05, vs. sham-operated (sham) group (one-way analysis of variance with Tukey's test).

