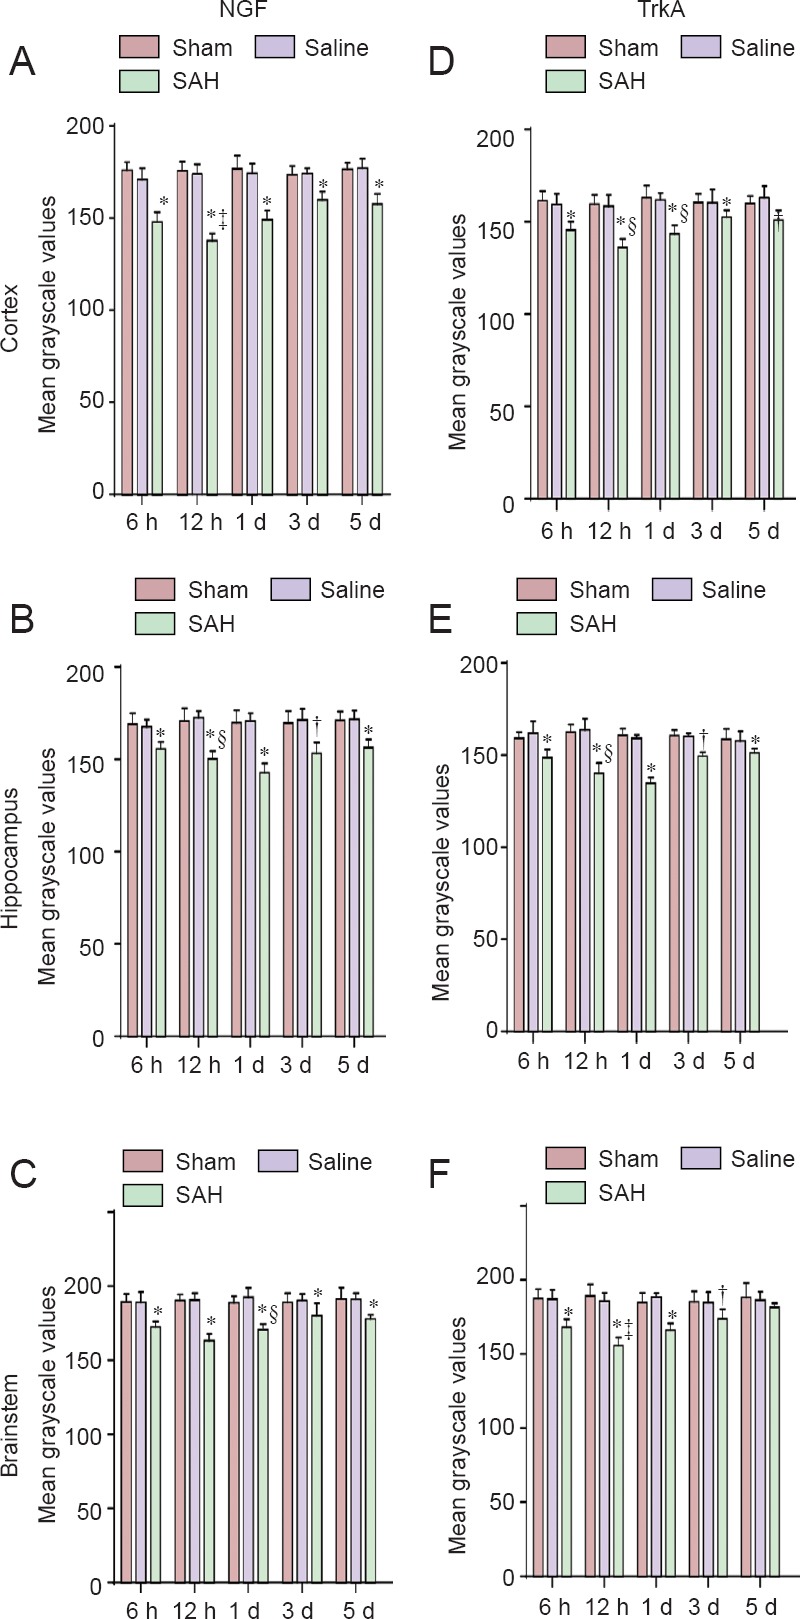
Figure 4.

Temporal variations in mean grayscale values of brain NGF and TrkA immunoreactivity in SAH rats.
Changes in NGF (A–C) and its receptor TrkA (D–F) immunoreactivity in the cortex, hippocampus, and brainstem of all groups. Lower grayscale values indicate stronger immunoreactivity. Three rat brains from each group (except for normal group) were randomly selected for immunohistochemical staining. Each brain region was present in two slices. Five fields were randomly selected in every slice, and mean grayscale values were calculated. Grayscale values for NGF and TrkA immunoreactivity in each brain region were determined and presented as the mean ± SD (n = 6) in each subgroup at each time point. All data followed a normal distribution. One-way analysis of variance followed by the least significant difference test. †P < 0.05, *P < 0.01, vs. normal, sham, and saline groups. §P < 0.05, ‡P < 0.01, compared within SAH groups. NGF: Nerve growth factor; SAH: subarachnoid hemorrhage; h: hours; d: day(s).
