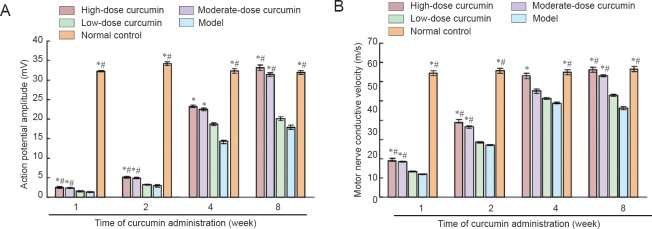
Figure 2.
Action potential amplitude (mV) and motor nerve conductive velocity (m/s) at 1, 2, 4, and 8 weeks following curcumin administration.
(A) Action potential amplitude; (B) motor nerve conductive velocity. Data are expressed as the mean ± SD, n = 5. One-way analysis of variance and Dunnett's test were used to analyze the differences among groups. *P < 0.05, vs. model group; #P < 0.05, vs. low-dose curcumin group. High-, moderate-, low-dose curcumin groups: curcumin 40, 20, and 10 mg/kg/d, respectively.

