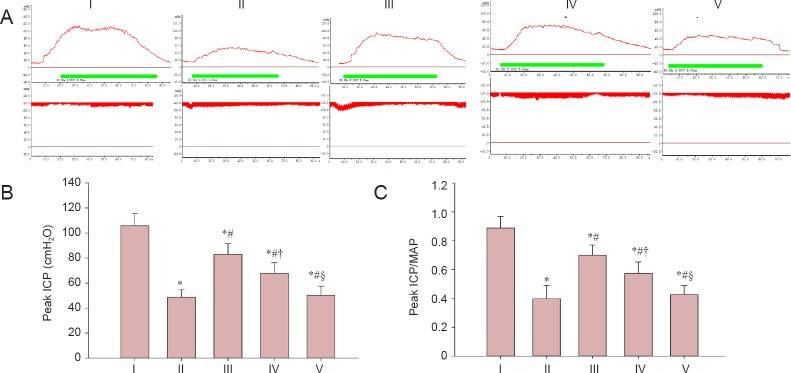
Figure 2.
Erectile function evaluated by electrical stimulation of cavernous nerve.
(A) ICP and MAP in response to pelvic ganglion stimulation. The red line (above) represents ICP. The green line represents electrostimulation time. The red line (below) represents MAP. (B) Mean peak ICP. (C) Mean peak ICP/MAP ratio. Data are expressed as the mean ± SD. One-way analysis of variance and Tukey post-hoc tests were used to assess differences between groups. *P < 0.05, vs. sham group; #P < 0.05, vs. injured group; †P < 0.05, vs. experimental A group; §P < 0.05, vs. experimental B group. In experimental A, B, and C groups, the rats were intragastrically administered LBP (10 mg/kg/d) for 2 consecutive weeks at 1, 7, and 14 days post-injury. ICP: Intracavernous pressure; MAP: mean arterial pressure. I: Sham; II: injured; III: experimental A; IV: experimental B; V: experimental C.

