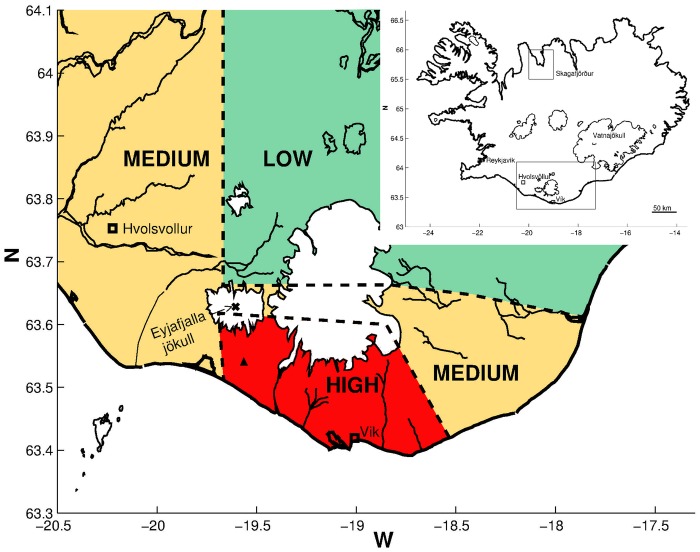
Figure 1.
Map of Iceland and study areas (as defined in Carlsen et al5). Inserted map of Iceland in the right corner shows the location of Skagafjörður in Northern Iceland (non-exposed area) and the exposed area in South Iceland. The larger map shows the exposed area with Eyjafjallajökull marked as X, the site of the measuring station with a Δ and the exposed areas divided into low, medium and high exposed areas.

