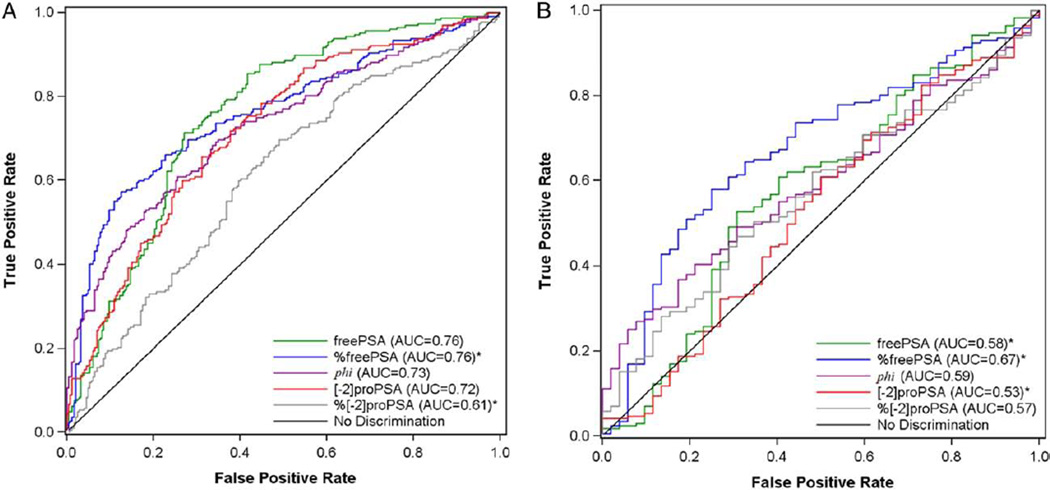
Figure 2.
ROC curves for all markers in all 474 subjects (A) and in 223 subjects with PSA in 2 to 10 ng/ml range (B). Asterisk indicates markers were lower in cancer group vs noncancer group. Therefore, sensitivity was defined as proportion of cancer cases with biomarker value equal to or less than cut point and specificity as proportion of controls with biomarker value exceeding cut point.

