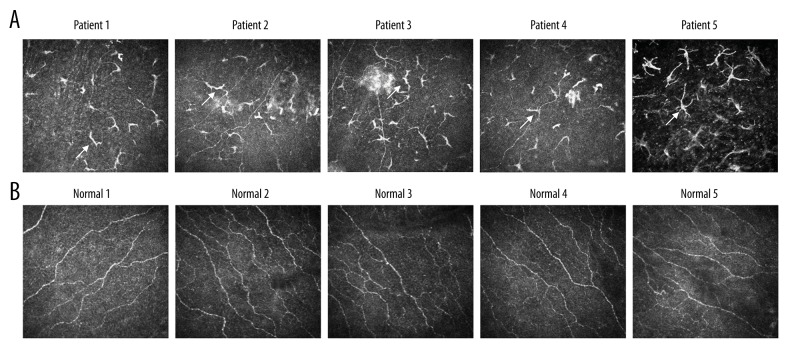
Figure 2.
Comparison for the cornea confocal microscope examination images in retinoblastoma patients and normal control individuals (randomly selected from the 20 patients). (A) The confocal images of 5 retinoblastoma patients. (B) The confocal images of 5 normal individuals. The arrows represent the tumid nerves, dendritic nerves, and curving nerves.

