
Figure 3.
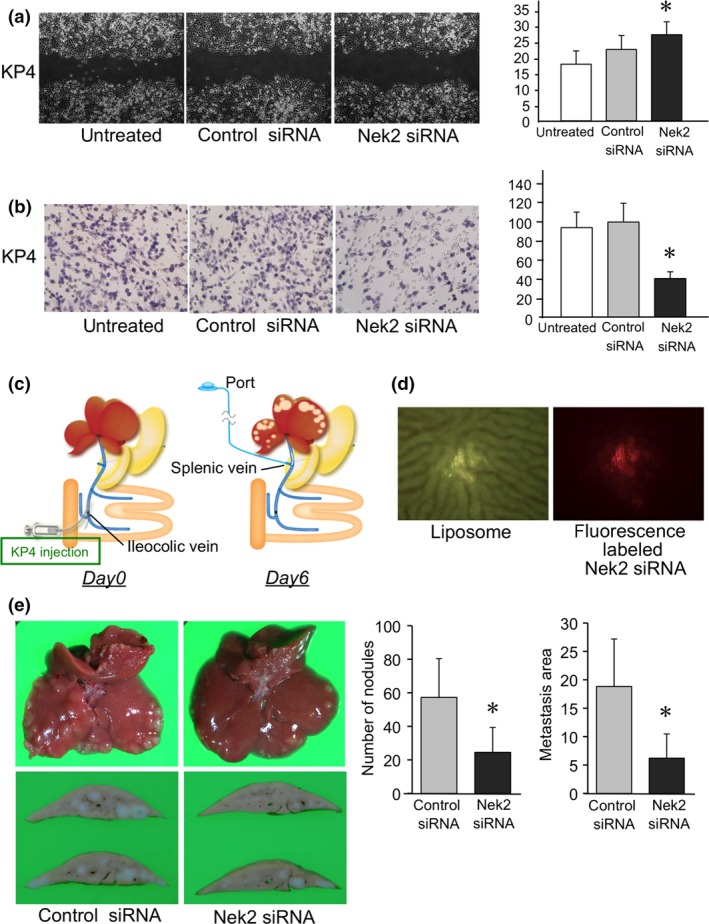
(a) Cell motility was assessed in KP4 cells 48 h after treatment with Nek2‐1 siRNA using a scratch wound healing assay. Graphs show the distance of the scratch at six points. Each bar in the graph represents the average distance in each experimental group ± SE. *Statistically significant (P < 0.05 vs control siRNA by Student's t‐test). (b) Cell invasion was assessed in KP4 cells 18 h after treatment with Nek2‐1 siRNA with an invasion assay using modified Boyden chambers. Invaded cells were stained with HE. Graphs show the area of invaded cells in five randomly selected fields. *Statistically significant (P < 0.05 vs control siRNA by Student's t‐test) (c) Schema demonstrating the procedure for the liver xenograft rat model and portal venous port–catheter system. (d) Photographs show that fluorescently labeled Nek2 siRNA and liposome was injected in the liver using the portal venous port–catheter system. (e) Photographs show liver metastasis after treatment with Nek2‐1 siRNA or control siRNA using the portal venous port–catheter system. Graphs show the number and area of liver metastasis in each group. Each bar in the graph represents the average number and area of liver metastasis in each experimental group ± SE. *Statistically significant (P < 0.05 vs control siRNA by Student's t‐test).