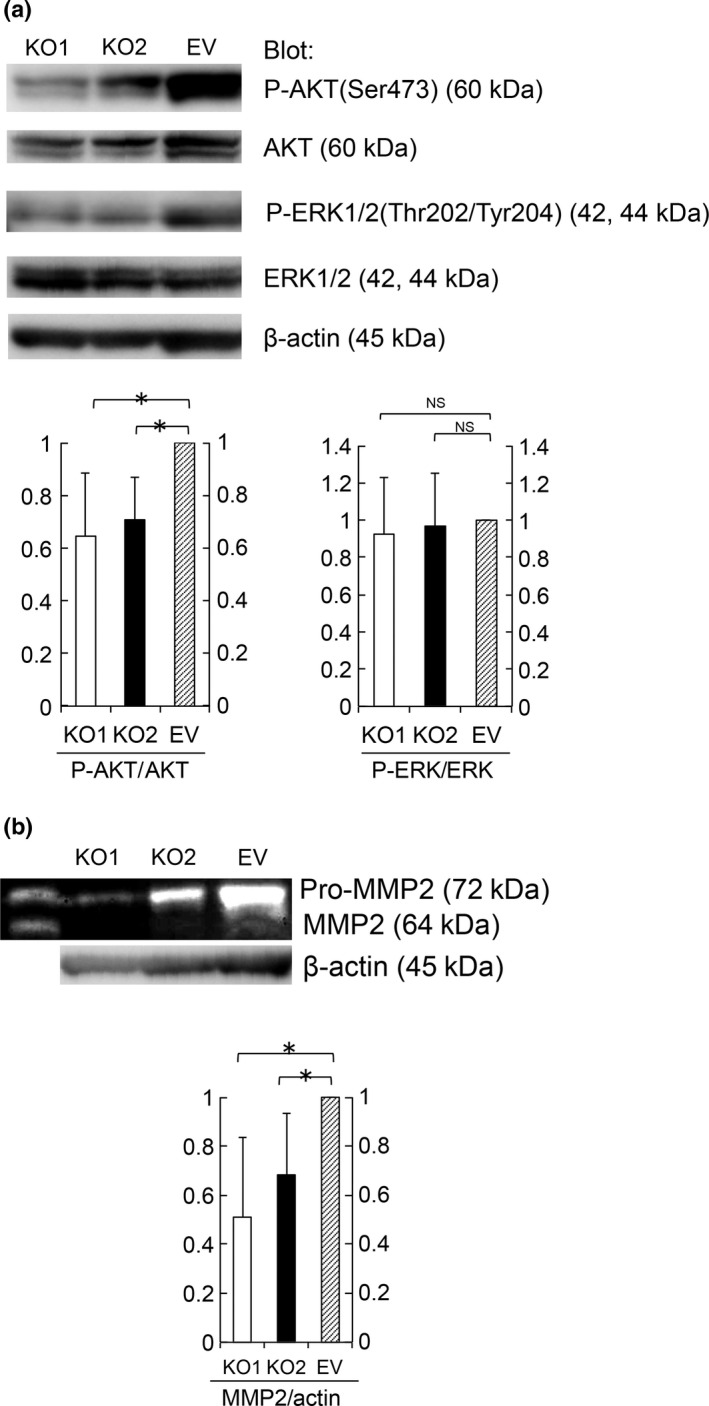
Figure 4.

S100A4 expression enhanced AKT phosphorylation and pro‐MMP2 activation. (a) AKT, P‐AKT, ERK1/2 and P‐ERK1/2 protein levels in KO1, KO2 and EV cell lysates were determined by immunoblotting. Equal cell loading was confirmed by quantifying β‐actin (input control). Data are representative of three independent experiments. We quantified the results using ImageJ. P‐AKT/AKT and P‐ERK/ERK quotient of EV cells is expressed as 1. The relative quotient of KO1 and KO2 cells is presented as the ratio to that of EV cells. Results are shown as the mean ± SE. Statistical analysis was determined using Student's t‐test. *P < 0.05. (b) Amount of pro‐MMP2 (72 kDa) and MMP2 (64 kDa) in supernatant from KO1, KO2 and EV cells was evaluated by a gelatin zymography assay. Equal cell loading was confirmed by quantifying via immunoblotting β‐actin in cell lysates (input control). Data are representative of three independent experiments. We quantified the results using ImageJ. MMP2/actin quotient of EV cells is expressed as 1. The relative quotient of KO1 and KO2 cells is presented as the ratio to that of EV cells. Results are shown as the mean ± SE. Statistical analysis was determined using Student's t‐test. *P < 0.05.
